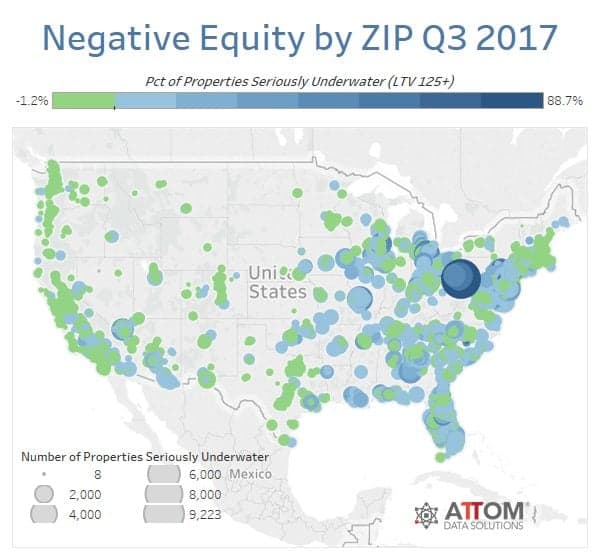
As outlined by ATTOM Data Solution’s Q3 2017 U.S. Home Equity and Underwater Report, the volume of homes seriously underwater has dropped from six million to 4.6 million – the biggest year-over-year decrease seen since Q2 2015.

The number of underwater homes has sunk by 2.1%
The 4.6 million seriously underwater properties (where the combined amount of the loan secured by the property was at least 25% greater than the property’s estimated market value) represented 8.7% of all U.S. properties with a mortgage, a 2.1 percentage point decrease from Q3 2016.
ATTOM Data Solutions Senior Vice President Daren Blomquist says the decline in underwater homes is a result of homeowners finally recovering home equity lost while in the recession.
“Median home prices nationwide are up 9.4% so far in 2017, the fastest pace of appreciation through the first three quarters of a year since 2013,” Blomquist said. “Continued home price appreciation is also helping to grow the number of equity-rich homeowners across the country compared to a year ago.”
Based on ATTOM Data Solution’s Q3 2017 U.S. Home Equity and Underwater Report, the amount of homes seriously underwater has dropped from six million to 4.6 million – the biggest year-over-year decrease seen since Q2 2015.
At the metro level, Baton Rouge, La. (20.5%); Scranton, Pa. (19.5%); Youngstown, Ohio (18.2%); New Orleans (17.4%); and Dayton, Ohio (16.4%) had the largest number of underwater homeowners.
Meanwhile, Hawaii (41.9%); California (41.4%); New York (35.7%); Oregon (34.0%) and Washington (33.6%) had the greatest numbers of equity-rich homes where the combined amount of the loan secured by the property was 50% or less of the estimated market value of the property.
And to no one’s surprise, San Jose, Calif.; San Francisco, Calif.; Los Angeles, Calif.; Honolulu, Hawaii; and Oxnard-Thousand Oaks-Ventura, Calif. led the way in the quantity of equity-rich homes, which coincides with each of these metros’ home value growth over the past year.
About the study
The ATTOM Data Solutions U.S. Home Equity and Underwater report provides counts of residential properties based upon several categories of equity – or loan to value (LTV) – at the state, metro, county and zip code level, combined with the percentage of total residential properties having a mortgage that all equity category represents. The equity/LTV is calculated in accordance with record-level open loan data and record-level estimated property value data derived from publicly recorded mortgage and deed of trust data collected and licensed by ATTOM Data Solutions nationwide for more than 150 million U.S. properties.
Ready to find out the current market value of your home? Nick & Cindy Davis with RE/MAX Premier Group are here to assist you. We are always a just a click here away or call 813-300-7116