The February 2019 housing report uses the numbers for January 2019. Declining Sales, Growing Inventory Continue to Move in Direction of Buyer’s Market, in accordance with the February RE/MAX National Housing Report that analyzes housing data in 54* metro areas. February 2019 RE/MAX ... » Learn More about National Housing Report-February 2019
Buying A Home? Find A Local Expert To Help You
December 2018 RE/MAX National Housing Report
The December 2018 RE/MAX National Housing Report housing report uses the numbers for November 2018.2018 Home Sales Cool-down, While Inventory Recovers and Price Increases Moderate. December’s declining home sales and growing inventory solidified 2018 as the year the red-hot seller’s market moved ... » Learn More about December 2018 RE/MAX National Housing Report
November 2018 RE/MAX Housing Report
The November 2018 housing report uses the numbers for October 2018. While July home sales decreased slightly, homes sold at a quicker rate than any month in nearly 10 years, in accordance with the August RE/MAX National Housing Report that analyzes housing data in 54* metro areas. November ... » Learn More about November 2018 RE/MAX Housing Report
3 Items to Know – September 2018 RE/MAX National Housing Report
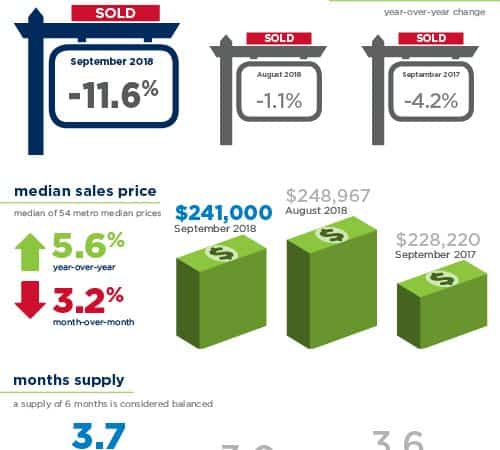
The September 2018 RE/MAX National Housing Report shows home sales took a 12% tumble while prices remain at record levels. “The big drop in September closings catches your attention. The market is clearly re-balancing as buyers and sellers continue to process the increasing interest rate ... » Learn More about 3 Items to Know – September 2018 RE/MAX National Housing Report
August 2018 RE/MAX National Housing Report
The August 2018 RE/MAX National Housing Report shows increasing home prices, low inventory and a decrease in days on market. These combined factors made August 2018 the sixth time this current year that home sales lagged behind last year’s pace-but only slightly at -1.1% August 2018 RE/MAX National ... » Learn More about August 2018 RE/MAX National Housing Report


