Rising Prices, Fewer Sales Driven by Record-Breaking Low Inventory. If you are searching for a new home, odds are you’re not finding many homes on the market. If you’re a seller, you might have likely noticed the value of your home is rising – regardless of what area of the country you are located in. The April 2018 Report uses numbers from March 2018.
April 2018 National Housing Report
As per the April 2018 RE/MAX National Housing Report, home prices continued to climb year-over-year for the 24th consecutive month in March, while home sales continued to decline for a fourth consecutive month, making it feel like a seller’s market in the majority of regions of the us. 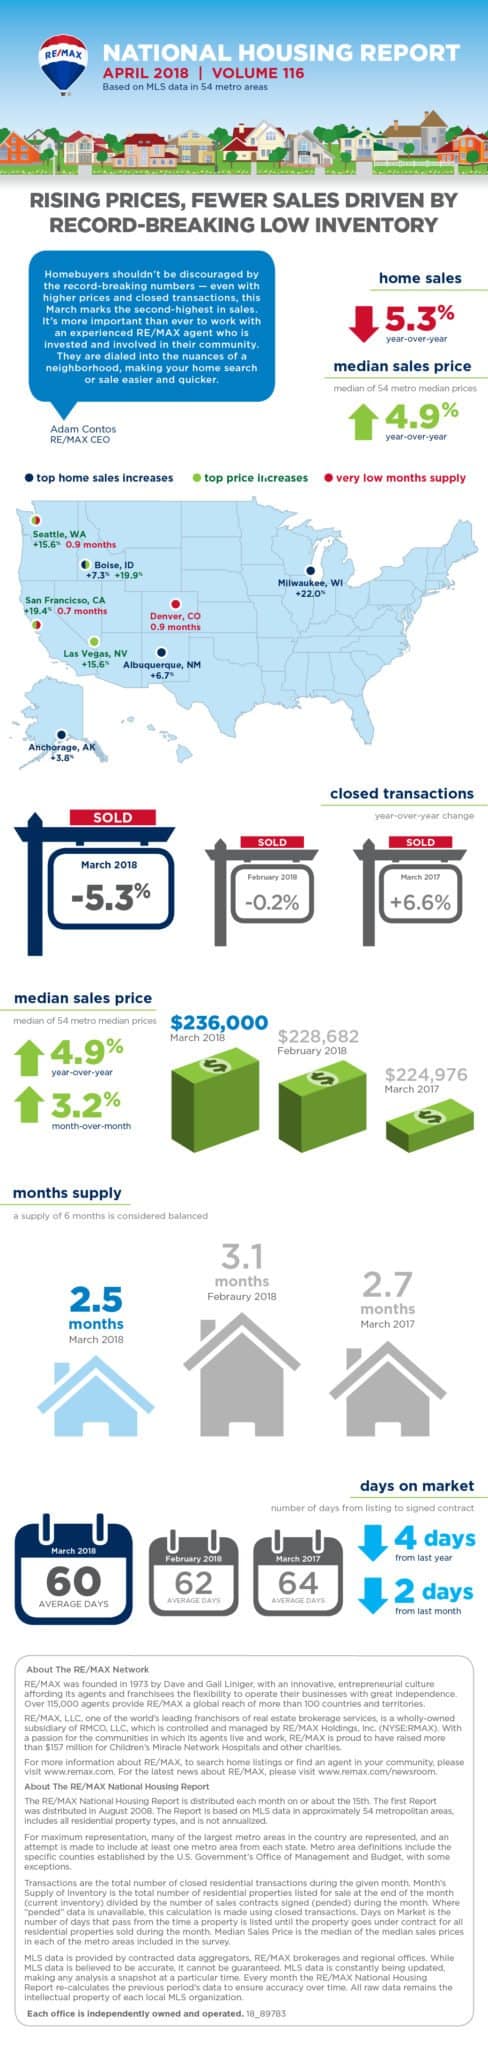
“Homebuyers shouldn’t be discouraged by the record-breaking numbers – even with higher prices and closed transactions, this March marks the second-highest in sales in the history of the RE/MAX National Housing Report,” said RE/MAX CEO Adam Contos. “It’s more important than ever to work with an experienced RE/MAX agent who is invested and involved in their community. They are dialed into the nuances of a neighborhood, making your home search or sale easier and quicker.”
Whenever the Months Supply of Inventory falls below 6 months, it’s a seller’s market, and every one of the 54 metro areas surveyed for the monthly housing reported under 6 months of inventory.
“We also look at the Days on Market as another indicator of tight inventory and the national average stands at 60 days,” said Contos. “That’s four days less than a year ago and another March record-breaker.”
Closed Transactions
Of the 54 metro areas surveyed in March 2018, the overall average quantity of home sales increased +36.6% in comparison to February 2018 and decreased -5.3% compared to March 2017. Nine of the 54 metro areas experienced a boost in sales year-over-year including, Milwaukee, WI, +22%, Boise, ID, 7.3%, Albuquerque, NM, +6.7%; and Anchorage, AK, +3.8%.
Median Sales Price – Median of 54 metro median prices
In March 2018, the median of all 54 metro Median Sales Prices was $236,000, up +3.2% from February 2018 and up +4.9% from March 2017. Four metro areas saw a year-over-year decline in Median Sales Price including, Anchorage, AK, -3.4%, Billings, MT, -1.1%, Trenton, NJ, -0.5%; and Manchester, NH, -.02%. Twelve metro areas increased year-over-year by double-digit percentages, with the largest increases observed in Boise, ID, +19.9%, San Francisco, CA, +19.4%; and Seattle, WA, and Las Vegas, NV, tied at +15.6%.
Days on Market – Average of 54 metro areas
The typical Days on Market for homes sold in March 2018 was 60, down 2 days from the average in February 2018, and down four days from the March 2017 average. The metro areas having the lowest Days on Market were San Francisco, CA, at 20, Seattle, WA, at 28, Denver, CO, at 30; and San Diego, CA, at 31. The highest Days on Market averages were in Augusta, ME, at 131, Burlington, VT, at 115, Chicago, IL, at 97; and Hartford, CT, at 96. Days on Market is the number of days between when a home is first listed in an MLS and a sales contract is signed.
Months Supply of Inventory – Average of 54 metro areas
The amount of homes for sale in March 2018 was down -0.5% from February 2018, and down -14.7% from March 2017. In accordance with the rate of home sales in March, the Months Supply of Inventory decreased to 2.5 from February 2018 at 3.1, along with decreased compared to March 2017 at 2.7. A 6.0-months supply indicates a market balanced equally between buyers and sellers. In March 2018, all 54 metro areas surveyed reported a months supply less than 6.0, which is typically considered a balanced market. The markets with the lowest Months Supply of Inventory continue to be in the west with San Francisco, CA, at 0.7, Denver, CO, and Seattle, WA, both at 0.9; and Boise, ID, and Omaha, NE, at 1.1.
To get a copy of this report:
Need to speak with us now? 813-300-7116
![]()
Start Your Personal Search
See All Homes For Sale in and Around Tampa Florida
- List View
- Map View
- Grid View
-
") $319,990
$319,990-
Lot Size6,534 sqft
-
Home Size1,825 sqft
-
Beds4 Beds
-
Baths3 Baths
-
Year Built2025
-
Days on Market1
-
-
") $615,000
$615,000-
Lot Size6,099 sqft
-
Home Size2,067 sqft
-
Beds4 Beds
-
Baths3 Baths
-
Year Built1998
-
Days on Market1
-
-
") $205,000
$205,000-
Lot Size436 sqft
-
Home Size1,200 sqft
-
Beds2 Beds
-
Baths3 Baths
-
Year Built1984
-
Days on Market1
-
-
") $950,000
$950,000-
Lot Size24,830 sqft
-
Home Size4,331 sqft
-
Beds6 Beds
-
Baths5 Baths
-
Year Built2007
-
Days on Market1
-
-
") $393,990
$393,990-
Lot Size4,792 sqft
-
Home Size2,305 sqft
-
Beds4 Beds
-
Baths3 Baths
-
Year Built2025
-
Days on Market1
-
-
") $280,000
$280,000-
Lot Size2,614 sqft
-
Home Size1,346 sqft
-
Beds2 Beds
-
Baths2 Baths
-
Year Built1965
-
Days on Market1
-
-
") $70,000
$70,000-
Lot Size9,584 sqft
-
Home Size975 sqft
-
Beds2 Beds
-
Baths1 Bath
-
Year Built1973
-
Days on Market1
-
-
") $355,000
$355,000-
Lot Size5,663 sqft
-
Home Size1,523 sqft
-
Beds3 Beds
-
Baths2 Baths
-
Year Built2022
-
Days on Market1
-
-
") $393,990
$393,990-
Lot Size4,792 sqft
-
Home Size2,305 sqft
-
Beds4 Beds
-
Baths3 Baths
-
Year Built2025
-
Days on Market1
-
")
")
")
")
")
")
See all All Homes Around Tampa.
(all data current as of
4/22/2025)
Listing information deemed reliable but not guaranteed. Read full disclaimer.