Every quarter, the U.S. Federal Reserve releases its report in connection with financial accounts of the United States. Although this is a very lengthy and detailed analysis, it will contain some interesting statistics on housing. The particular “nuggets” that we search for relate to the complete value of residential real estate, mortgage debt and, rather importantly, details regarding homeowner equity.

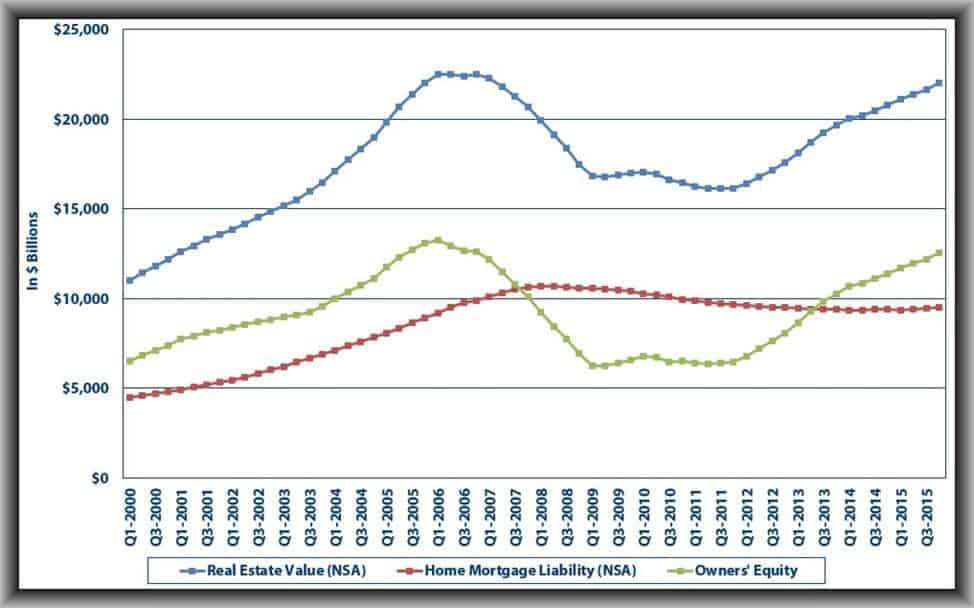
The chart below shows all of these data-sets dating back to 2000, and also the outcomes are rather fascinating. With regard to total real estate values, you can clearly understand the pre-bubble run-up and subsequent burst that followed. From its peak figure of $22.5 trillion at the end of 2006, home values lost a significant $6.4 trillion in value by mid-2011.

Rise in homeowner equity will continue to stabilize housing market
However, what is all the more interesting is that by the end of 2015, home values had regained almost all of the value they lost in the past years and now stand at $22.03 trillion. A price recovery is clearly in position. But this isn’t the end of the story. As much as we like to see housing values grow, if this growth is simply led by leverage (borrowing), then it’s a house of cards. However, we are pleased to say that this is simply not the situation here.
While home values have risen quite quickly over the past four years, we now have added not much to the debt load. As the chart above shows, mortgages peaked in 2008 at around $10.7 trillion, but have since tapered to $9.49 trillion, and stay well below their historic peak.
So what does all this mean?
It means that with house prices rising and consumers failing to take on additional mortgage debt, equity levels have grown substantially. The united states experienced a very painful period of negative equity during the housing recession, but the growth started returning in 2012, and we moved back into a time period of positive equity again by the summer of 2013.
In 2015, equity levels increased by an impressive 10.2 percent to $1.17 trillion. Total owner equity now stands at $12.54 trillion and is closing in on the all-time high seen in 2006. With the appreciable gain in homeowner equity levels, we have seen an instant drop in the number of “underwater” homes, along with an increase in so-called “equity-rich” homes (those with a loan-to-value ratio of lower than 50 %).
CoreLogic suggests that the percent of underwater homes has dropped to 8.5 % at the end of 2015 – down from 25.9 percent in early 2010 – and according to RealtyTrac, the percentage of “equity-rich” homes has recently risen to 22.5 %.
This data should ease people’s concerns with regards to the formation of a housing bubble – at least a national one. Growing equity levels will definitely work as a cushion against unforeseeable drops in home values. If this type of data does show one potential issue, it is that we will likely start to see more “move-up buyers” go into the real estate market while they make use of regained equity and look to up size. On the downside, this may put more buyers into an already-crowded marketplace, but it could also lead to a new supply of homes for sale – something that is much-needed in markets all across the U.S.
So whether you are in the market to find your new or sell your current house. Nick & Cindy Davis can assist you in the Tampa Bay and surrounding areas. We are always available by simply clicking here or you can call us at 813-300-7116 so we can get started working for you.