We are now past the half way mark for 2017 and we wanted to share with you the June Housing Statistics for Hillsborough County. We will be comparing June 2017 vs June 2016 and hopefully you will be as glad as we are with the data we collected.
Hillsborough County consists of the following cities and towns: Apollo Beach, Balm. Brandon, Dover, Durant, Gibsonton, Lithia, Lutz, Mango, Odessa, Plant City, Riverview, Ruskin, Seffner, Sun City, Sun City Center, Sydney, Tampa, Thonotosassa, Valrico and Wimauma.
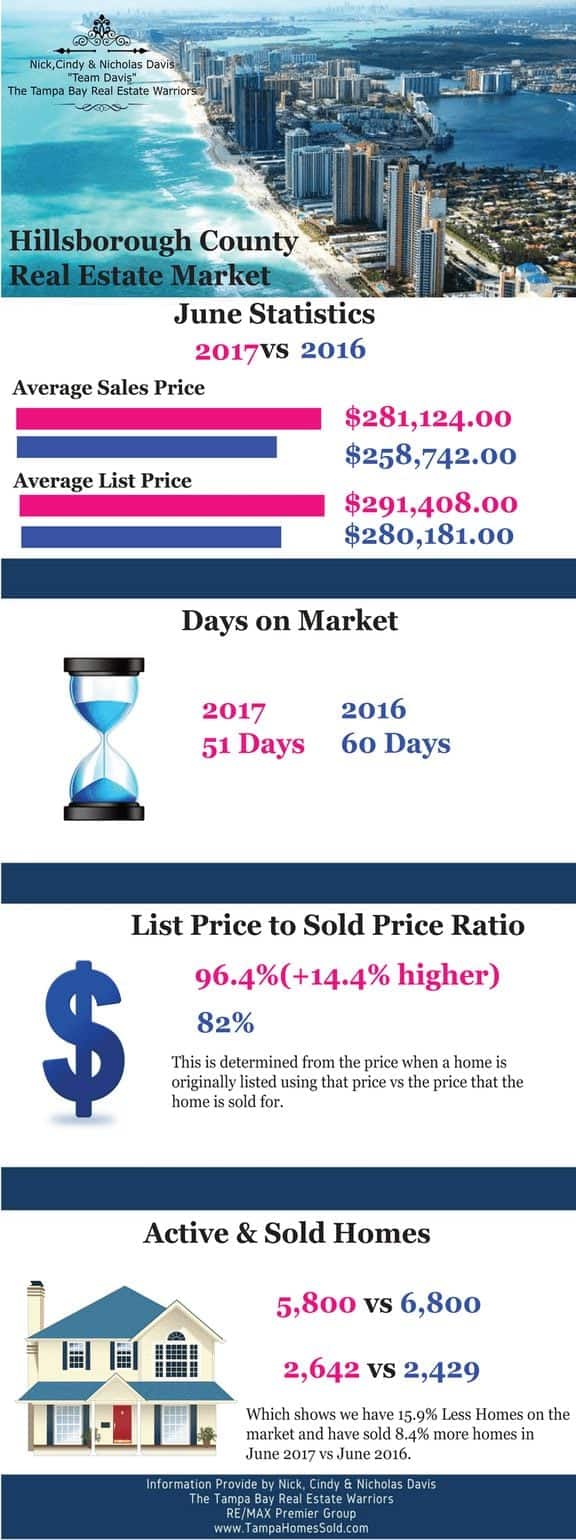
June Housing Statistics for Hillsborough County
We queried the Mid Florida Regional MLS (MFR MLS) System to gather the information for you.
Our Average list price is up nearly $10,000 from last year, while the average sales price is up over $31,000.
We are seeing the sellers who are realistic and list there home based on the sales are selling their homes in less time and for more money!
Days on market is down from last year, again meaning that the homes priced right are selling sometimes faster than a sign can be put in the yard.
With regards to List Price VS Sales Price, we used the original list price and the final sales price to calculate our percentages and with that said. 2017 was a good month for our sellers. They sold at 96.4% of their original list price. Which was 14.4% higher than June 2016.
Well, unfortunately all cannot be good news. Our inventory of active homes for sale is down 15.9% which makes it harder for buyers since there are less homes for sale.
On a final note the number of sales for June 2017 were 2, 642 homes were sold in Hillsborough County. Which is actually up 8.4% from June 2016.
If you would a copy of this infographic we have made it very easy for you to download.
Ready to find your new home? Or do you need to find out what the value of your current home is? Nick & Cindy Davis with RE/MAX Premier Group are here to assist you. We are always a just a call to either (813) 300-7116 or (813) 695-6475 or a click here away.
Find Your New Home Here!
See All Homes in and Around Tampa Florida
- List View
- Map View
- Grid View
-
") $100,000
$100,000-
Lot Size7,841 sqft
-
Home Size1,130 sqft
-
Beds2 Beds
-
Baths1 Bath
-
Year Built1959
-
Days on Market1
-
-
") $1,180,000
$1,180,000-
Lot Size10,455 sqft
-
Home Size2,782 sqft
-
Beds4 Beds
-
Baths3 Baths
-
Year Built2005
-
Days on Market1
-
-
") $349,900
$349,900-
Lot Size6,970 sqft
-
Home Size1,143 sqft
-
Beds4 Beds
-
Baths2 Baths
-
Year Built1957
-
Days on Market1
-
-
") $429,999
$429,999-
Lot Size4,792 sqft
-
Home Size2,208 sqft
-
Beds3 Beds
-
Baths3 Baths
-
Year Built2004
-
Days on Market1
-
-
") $375,000
$375,000-
Lot Size6,099 sqft
-
Home Size1,914 sqft
-
Beds4 Beds
-
Baths3 Baths
-
Year Built2022
-
Days on Market1
-
-
") $324,900
$324,900-
Lot Size7,406 sqft
-
Home Size1,959 sqft
-
Beds3 Beds
-
Baths2 Baths
-
Year Built1989
-
Days on Market1
-
-
") $117,700
$117,700-
Lot Size
-
Home Size682 sqft
-
Beds1 Bed
-
Baths1 Bath
-
Year Built1973
-
Days on Market1
-
-
") $1,499,000
$1,499,000-
Lot Size11,326 sqft
-
Home Size2,864 sqft
-
Beds4 Beds
-
Baths4 Baths
-
Year Built1967
-
Days on Market1
-
-
") $229,900
$229,900-
Lot Size6,099 sqft
-
Home Size1,302 sqft
-
Beds3 Beds
-
Baths2 Baths
-
Year Built1974
-
Days on Market1
-
-
") $375,000
$375,000-
Lot Size6,534 sqft
-
Home Size1,905 sqft
-
Beds3 Beds
-
Baths2 Baths
-
Year Built2005
-
Days on Market1
-
-
") $893,900
$893,900-
Lot Size10,455 sqft
-
Home Size3,891 sqft
-
Beds4 Beds
-
Baths4 Baths
-
Year Built2019
-
Days on Market1
-
-
") $210,000
$210,000-
Lot Size4,792 sqft
-
Home Size988 sqft
-
Beds3 Beds
-
Baths2 Baths
-
Year Built1987
-
Days on Market1
-
-
") $620,000
$620,000-
Lot Size6,099 sqft
-
Home Size2,135 sqft
-
Beds4 Beds
-
Baths3 Baths
-
Year Built2022
-
Days on Market1
-
-
") $4,950,000
$4,950,000-
Lot Size15,682 sqft
-
Home Size3,925 sqft
-
Beds4 Beds
-
Baths5 Baths
-
Year Built2019
-
Days on Market1
-
")
See all All Homes Around Tampa.
(all data current as of
4/17/2025)
Listing information deemed reliable but not guaranteed. Read full disclaimer.
![]()

![]()